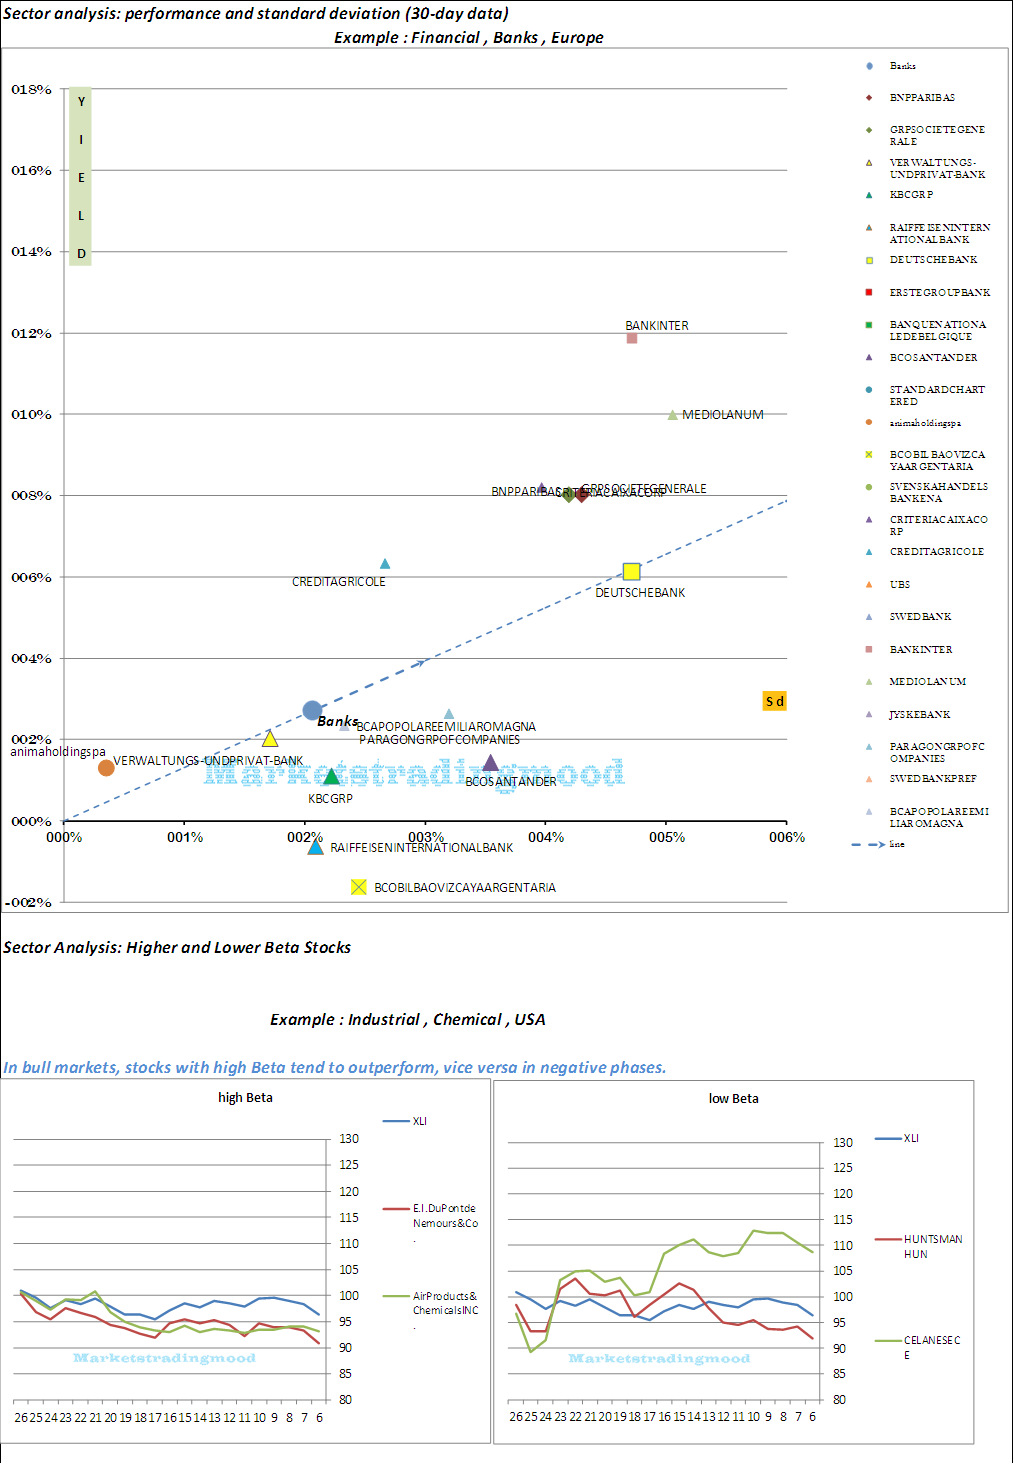
In this page , some traditional analysis , and personal ones , based on a less conventional point of view , to better understand where we were and actually are , by different time frames . Year-to-date or longer . Sectors are for european markets , currency crosses are vs.Euro and charts are updated daily , if not otherwise specified .
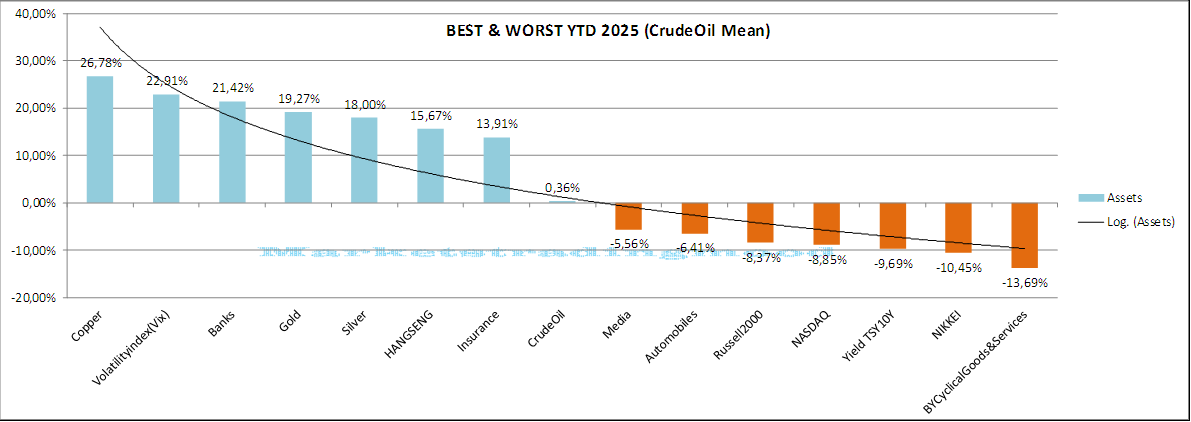
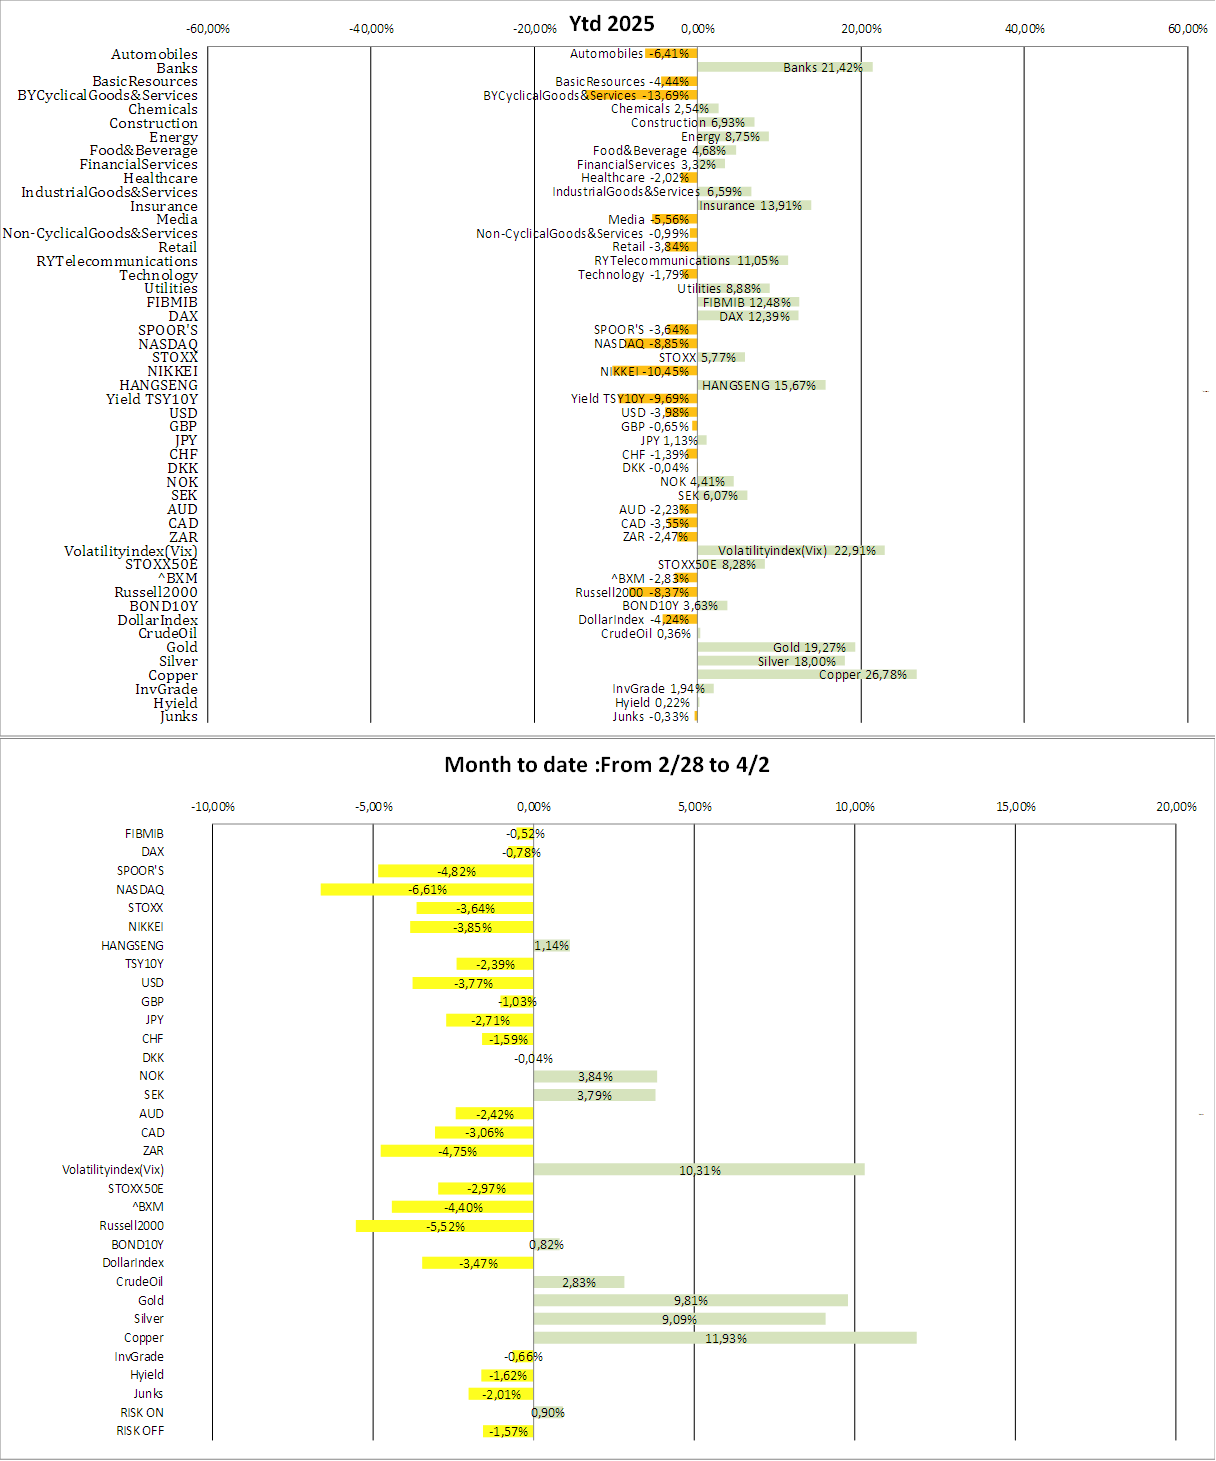
The best and worst assets year-to-date and month-to-date.
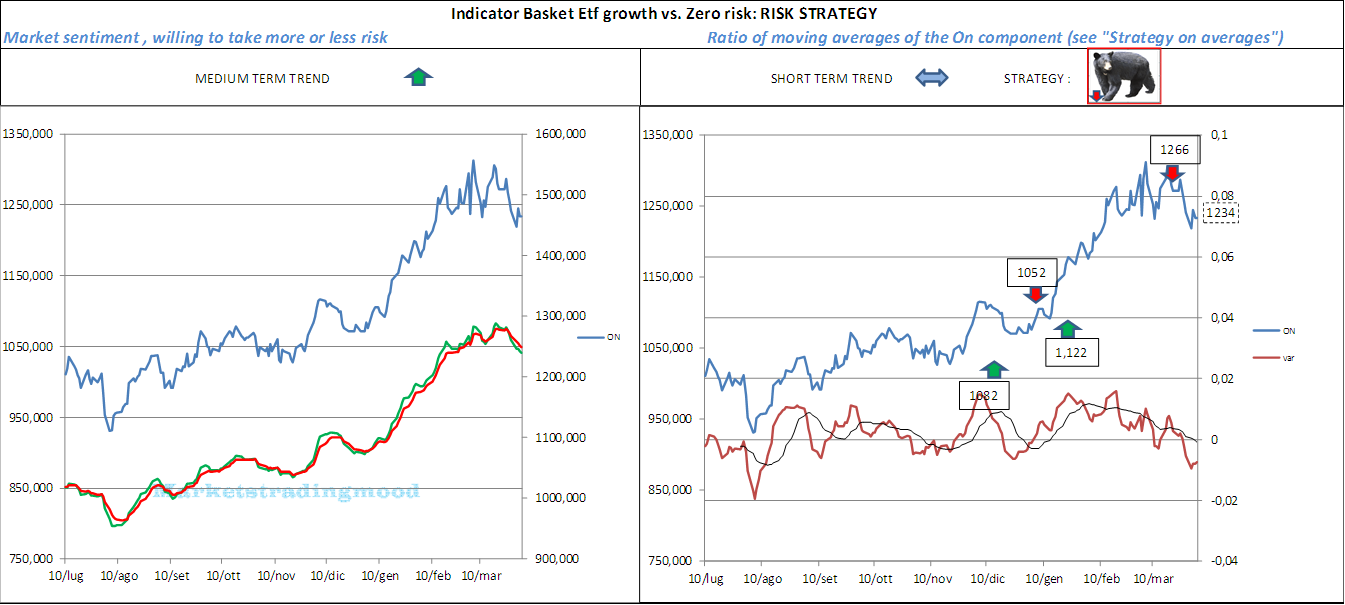
Risk Strategy : performance of a basket of risk-markets correlated Etfs , vs. zero-risk liquidity .
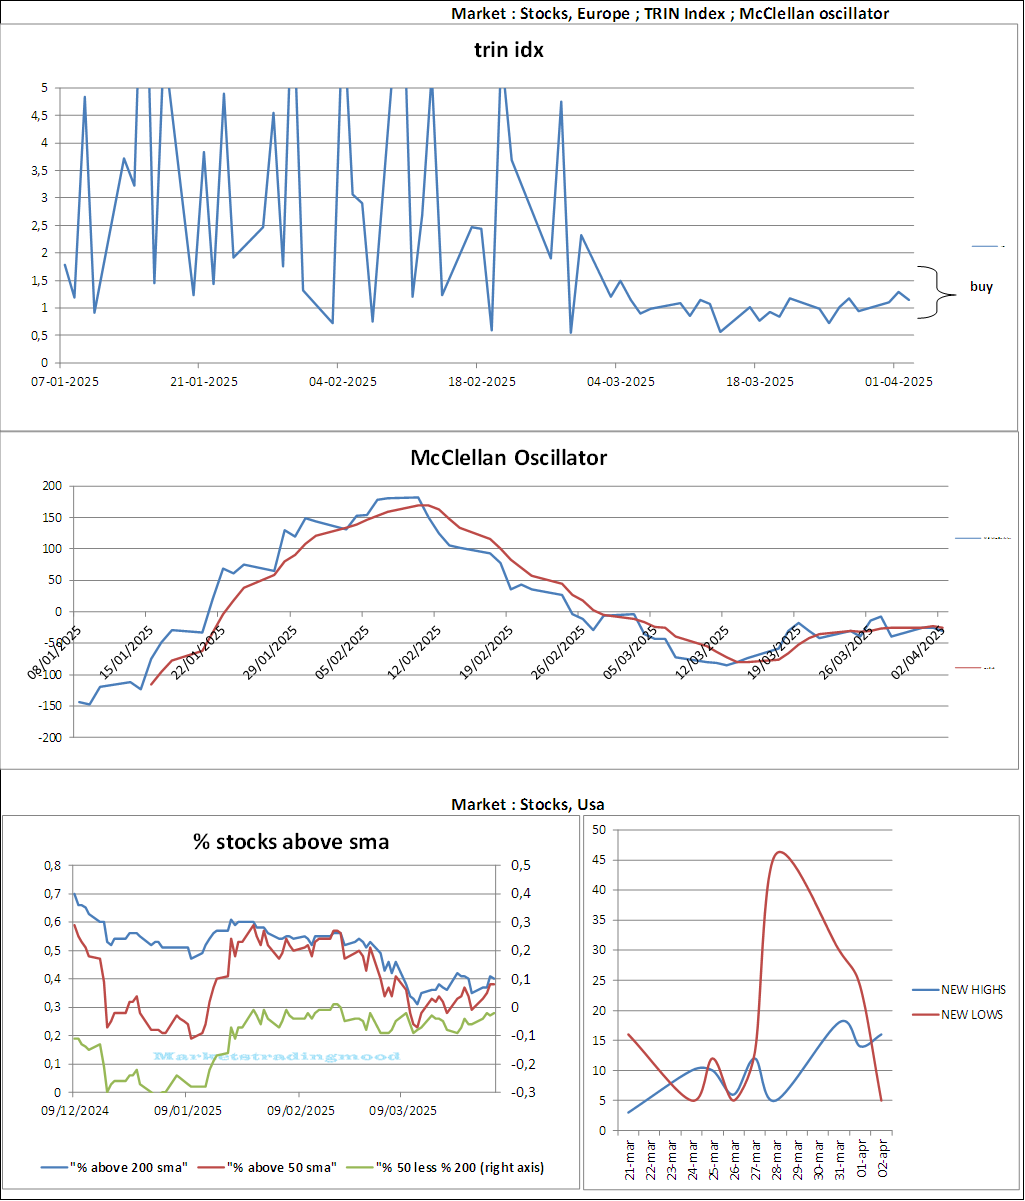
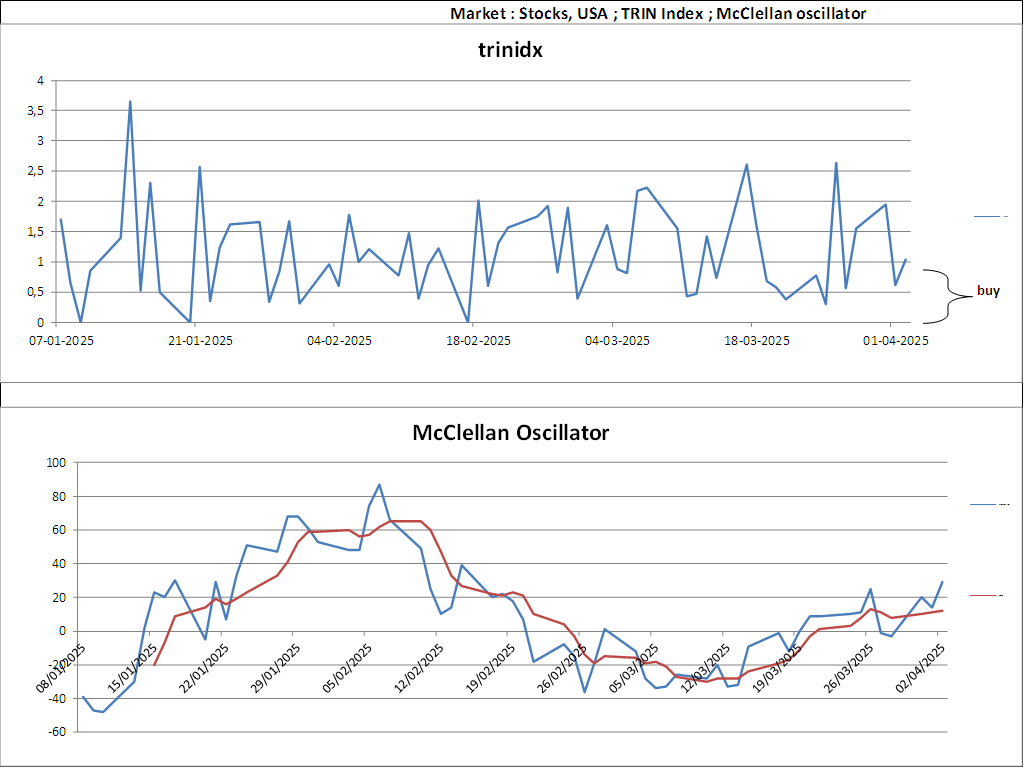
Trin index and oscillator , plus new high and lows stocks
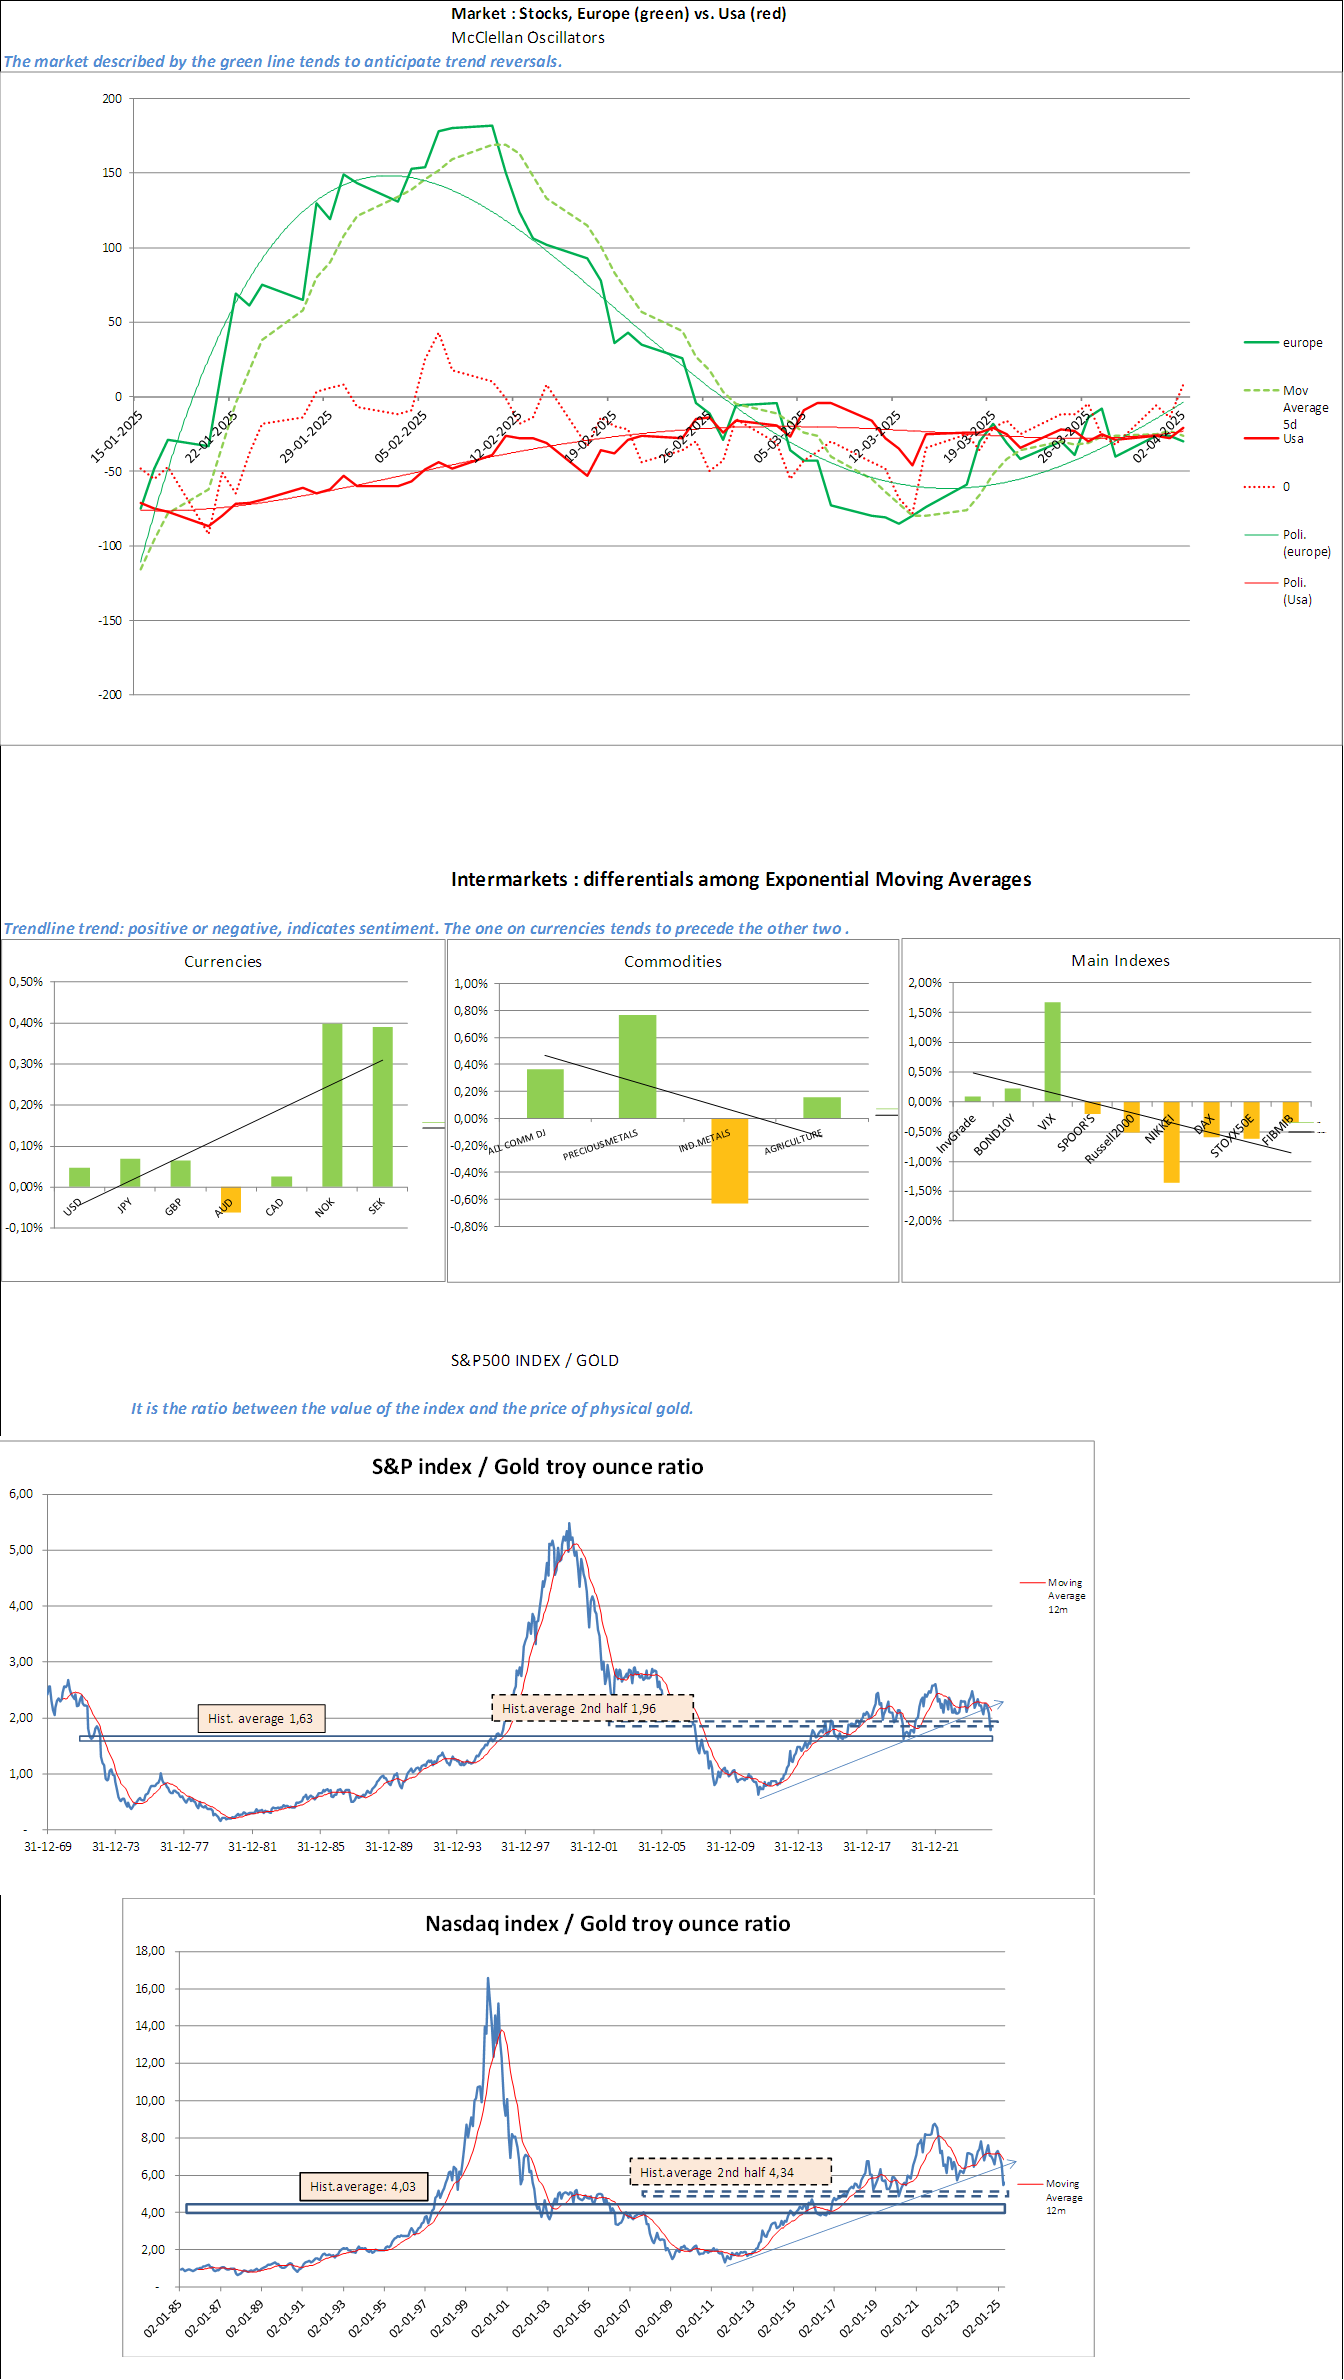
Europe and Usa stock market oscillators , plus S&P and Nasdaq indexes / Gold Troy Ounce ratios
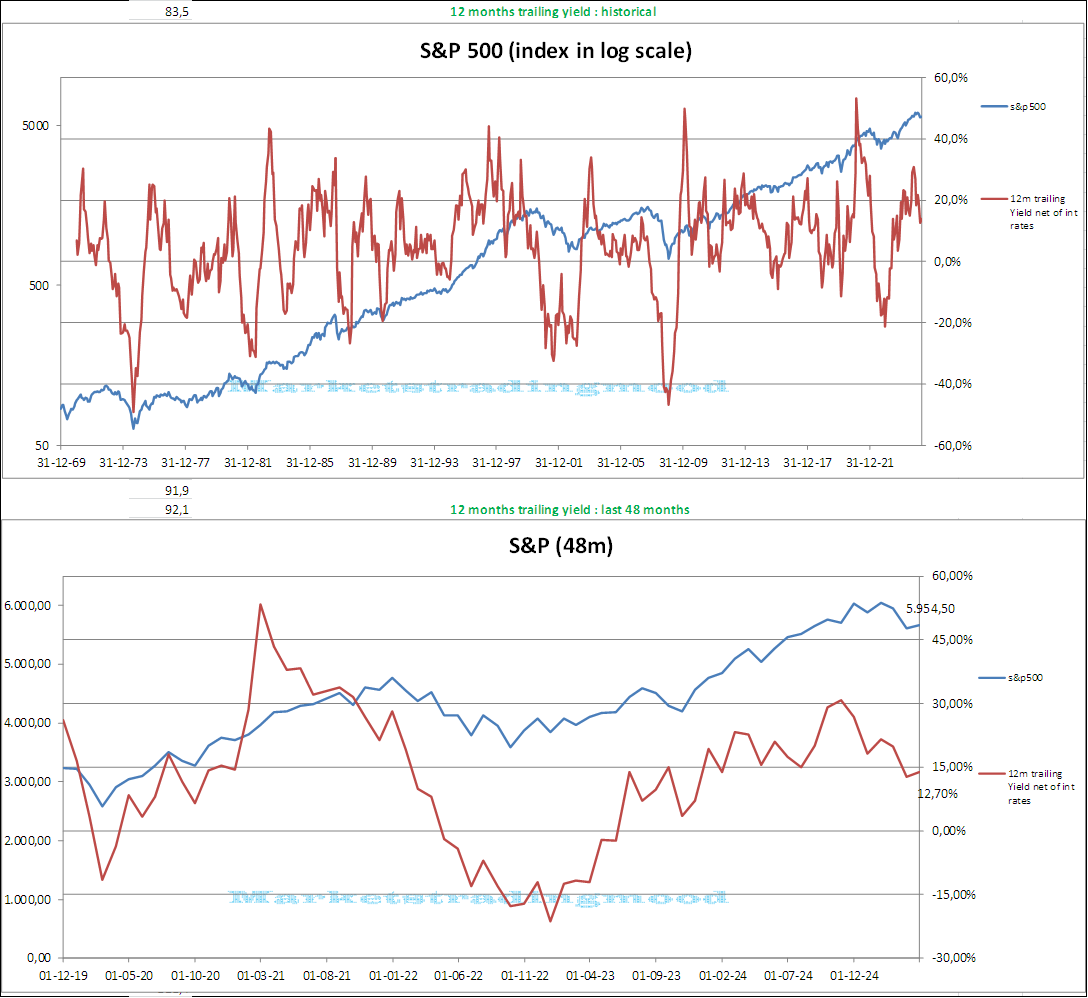
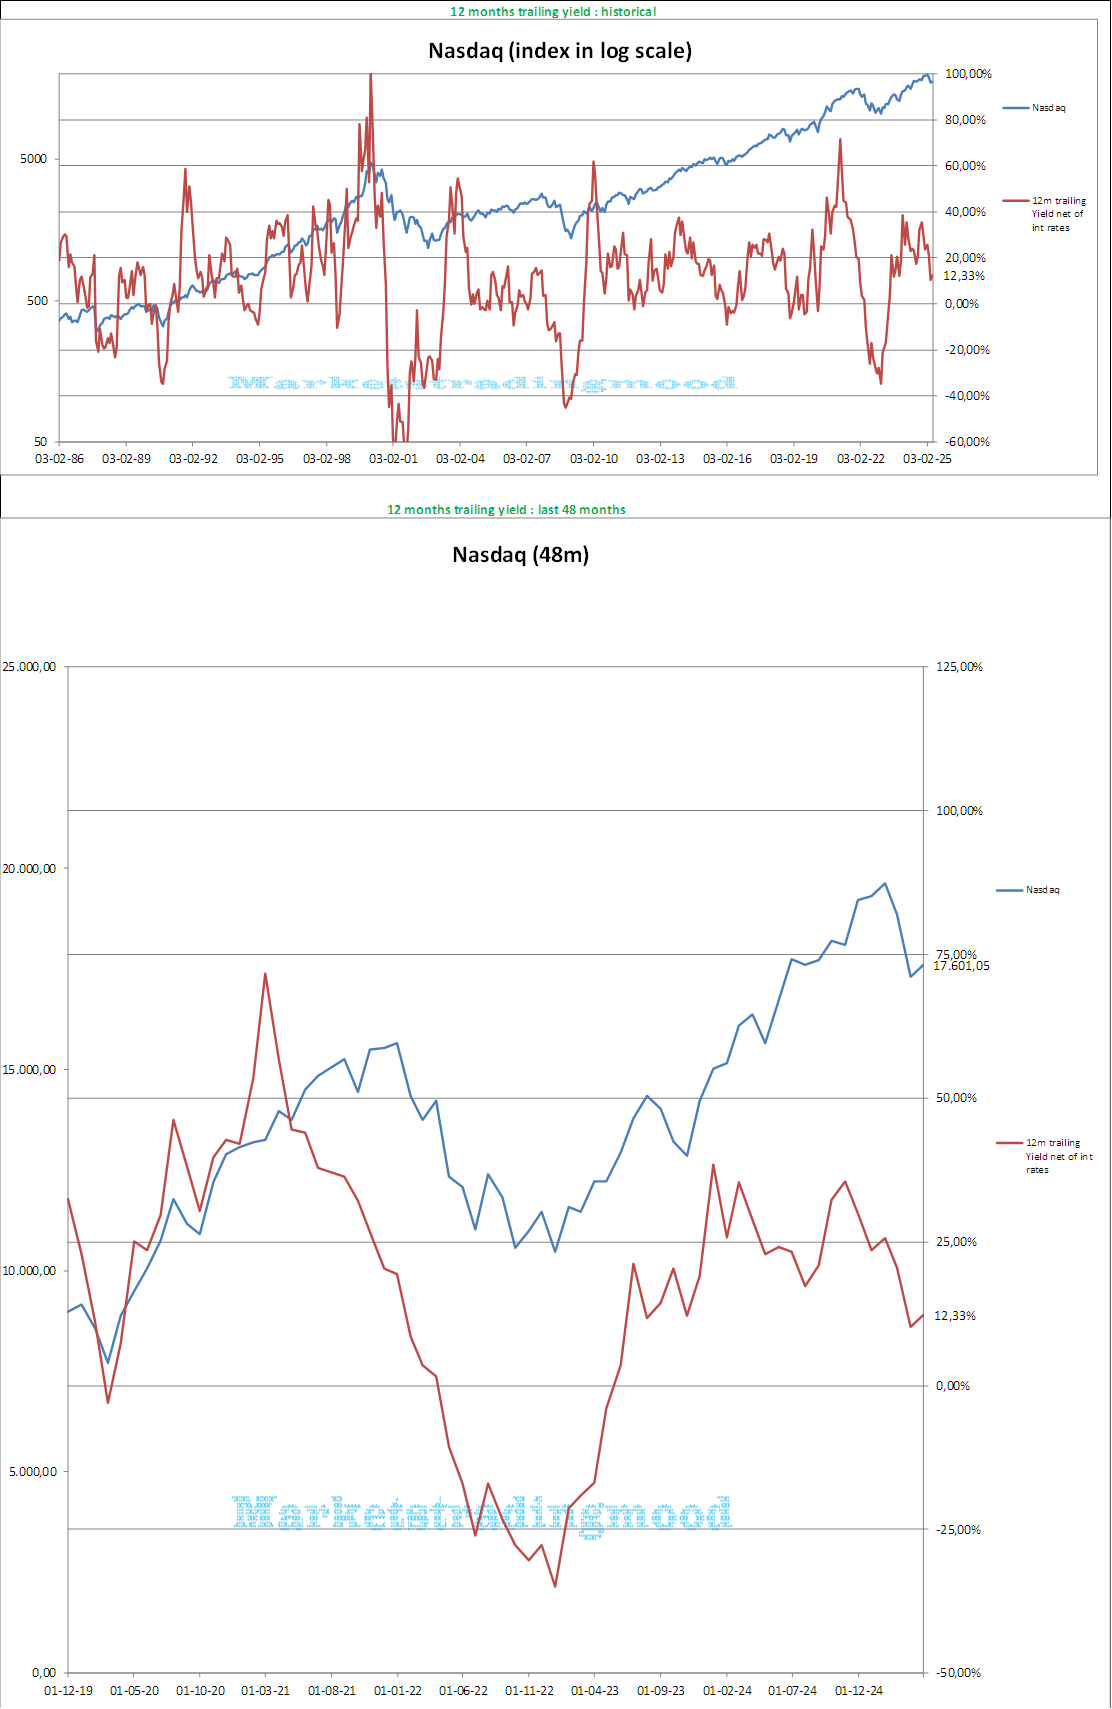
12 months S&P and Nasdaq trailing index perfomance
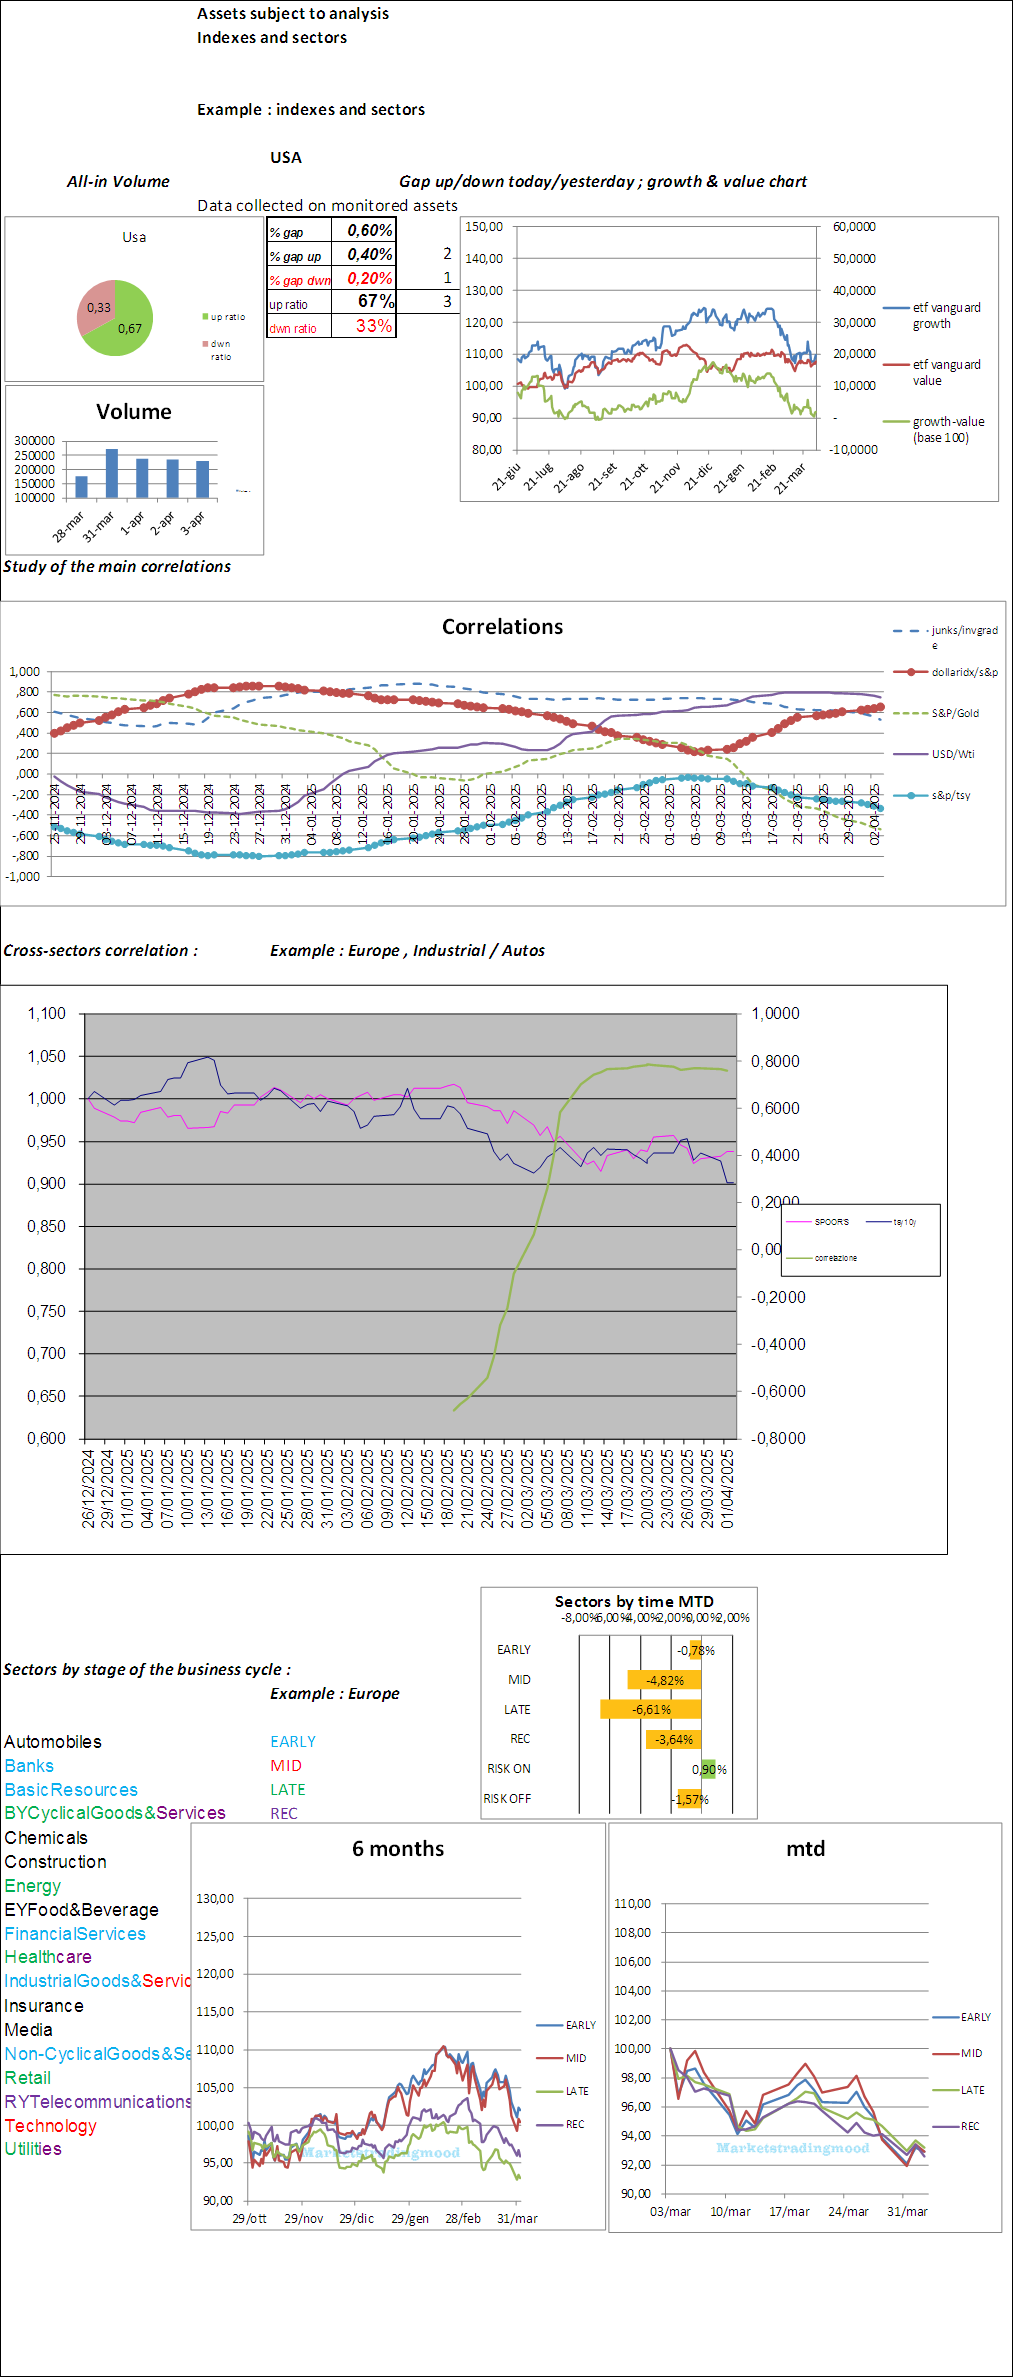
Studies on indexes and sectors , gap volumes , growth/value , assets correlations , business cycle
The charts below are updated weekly on Sundays
Single asset analysis example

Sector and beta stocks charts
