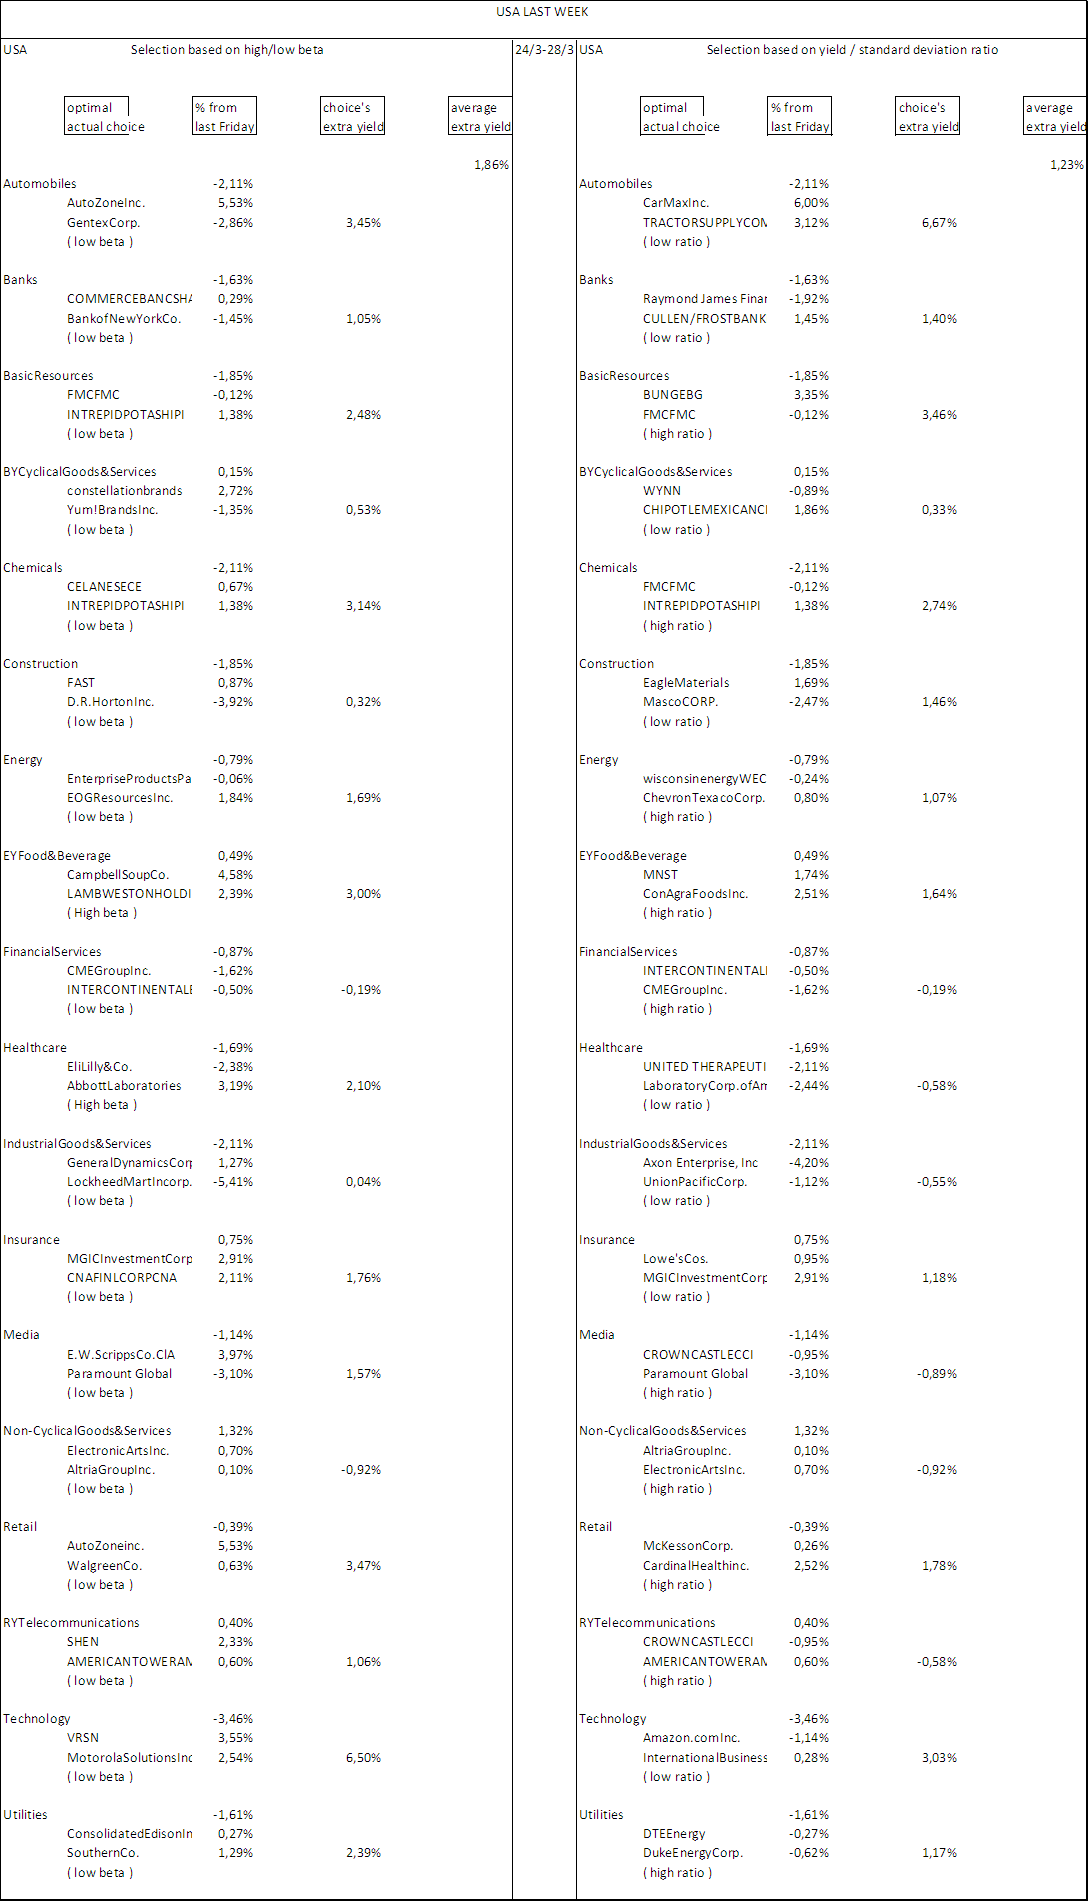
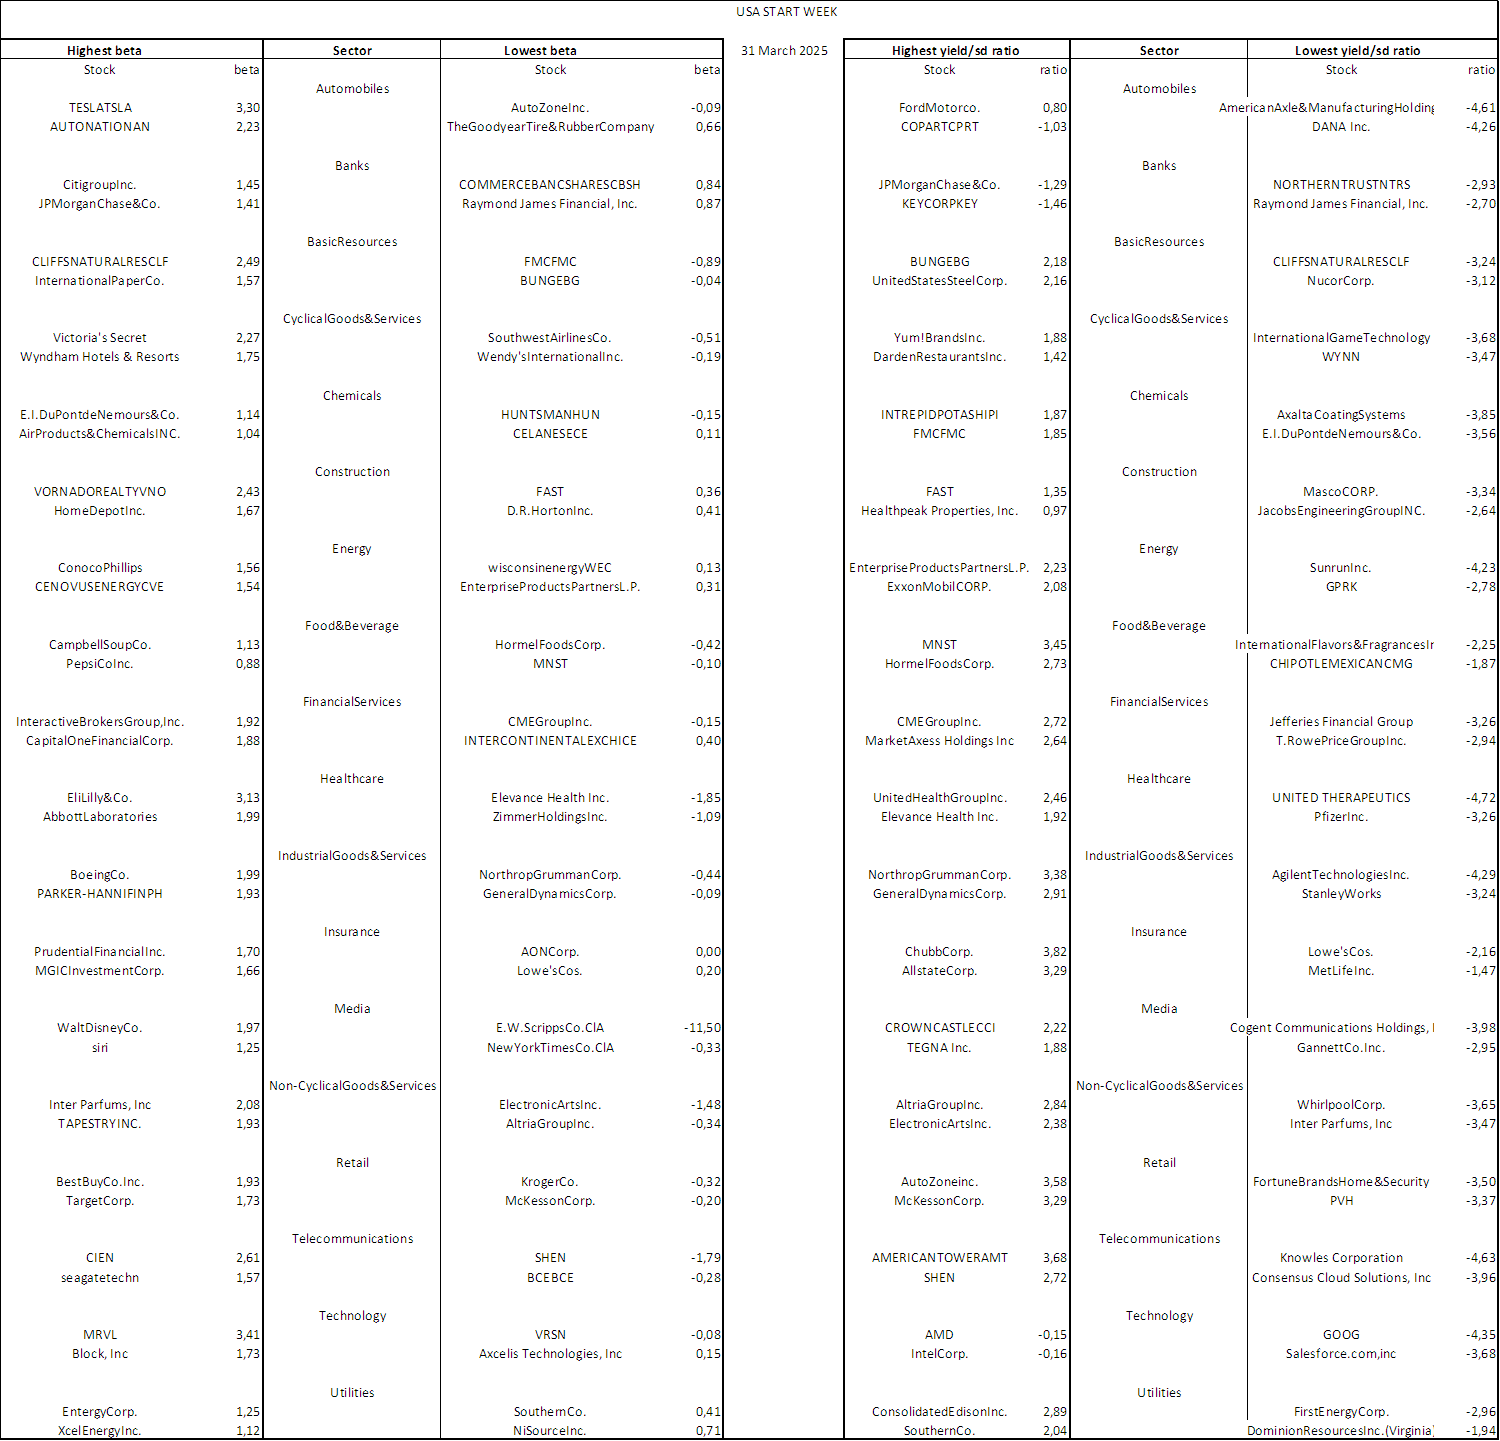
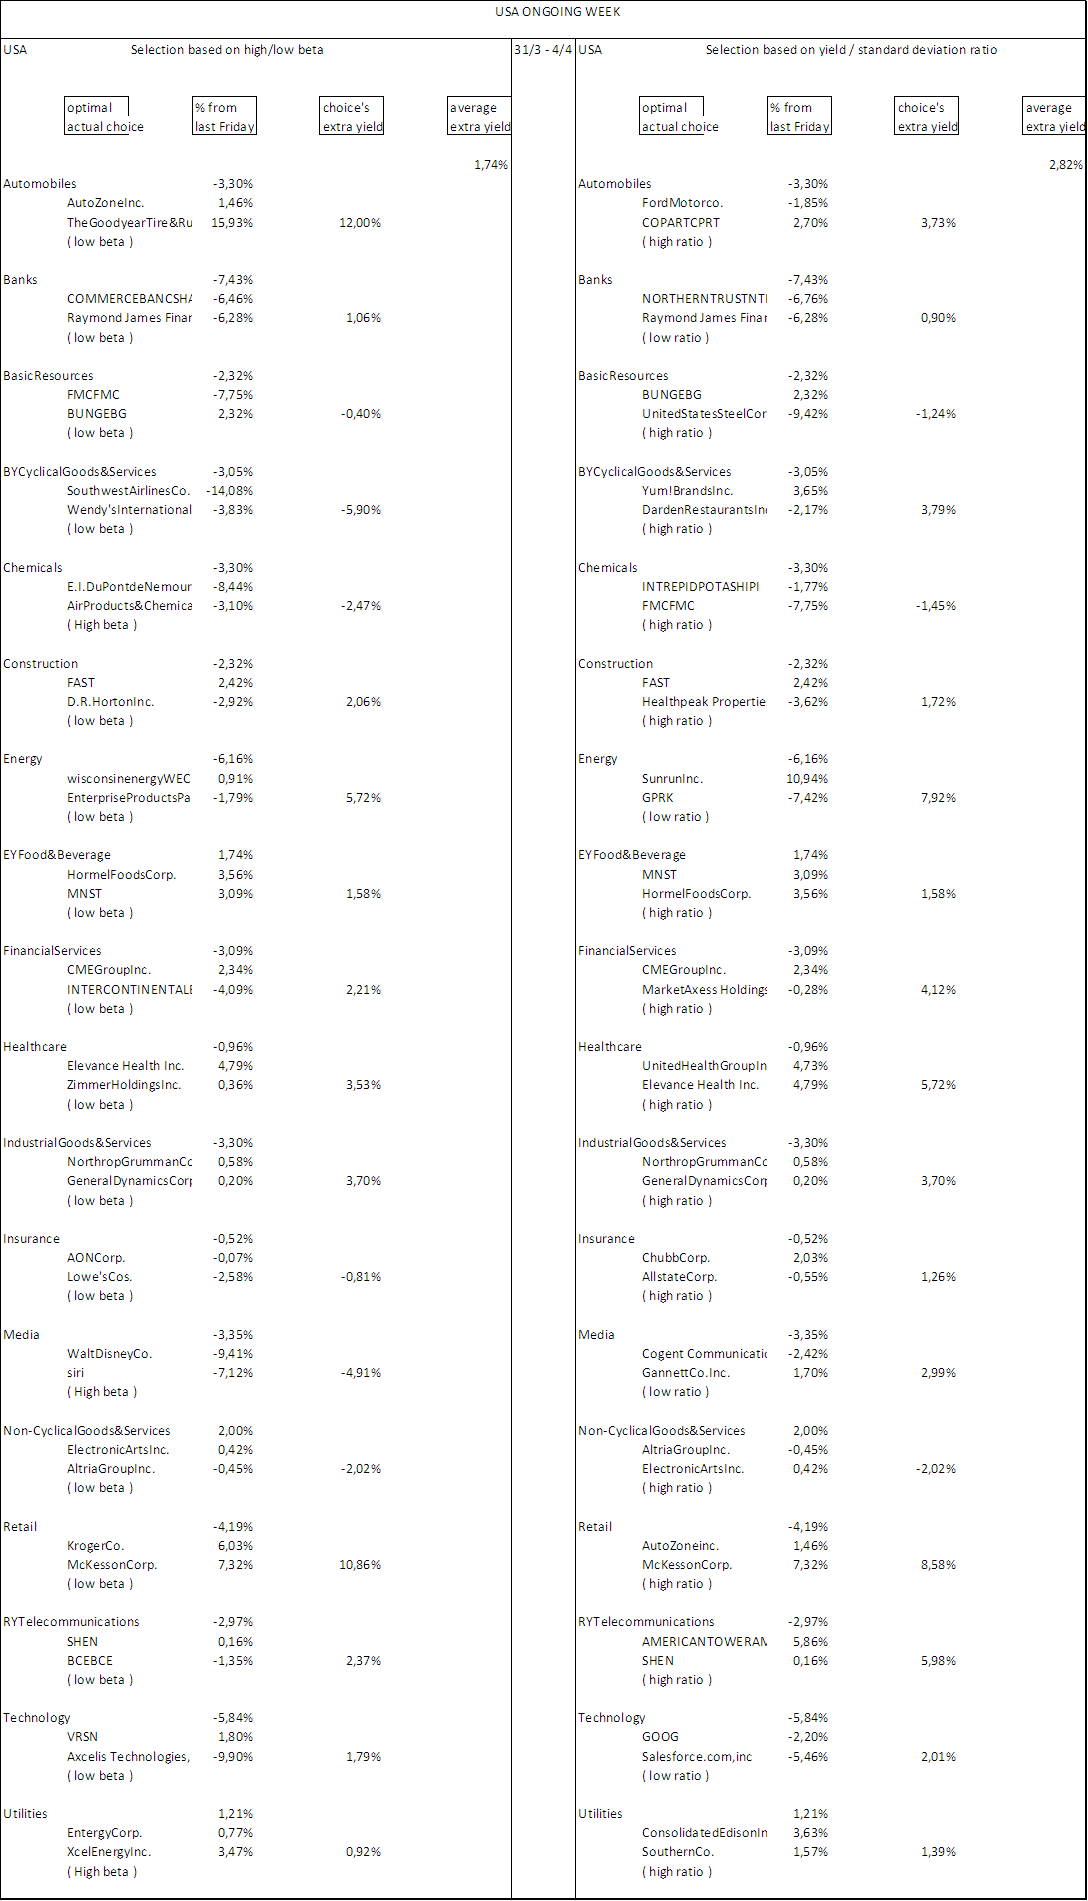
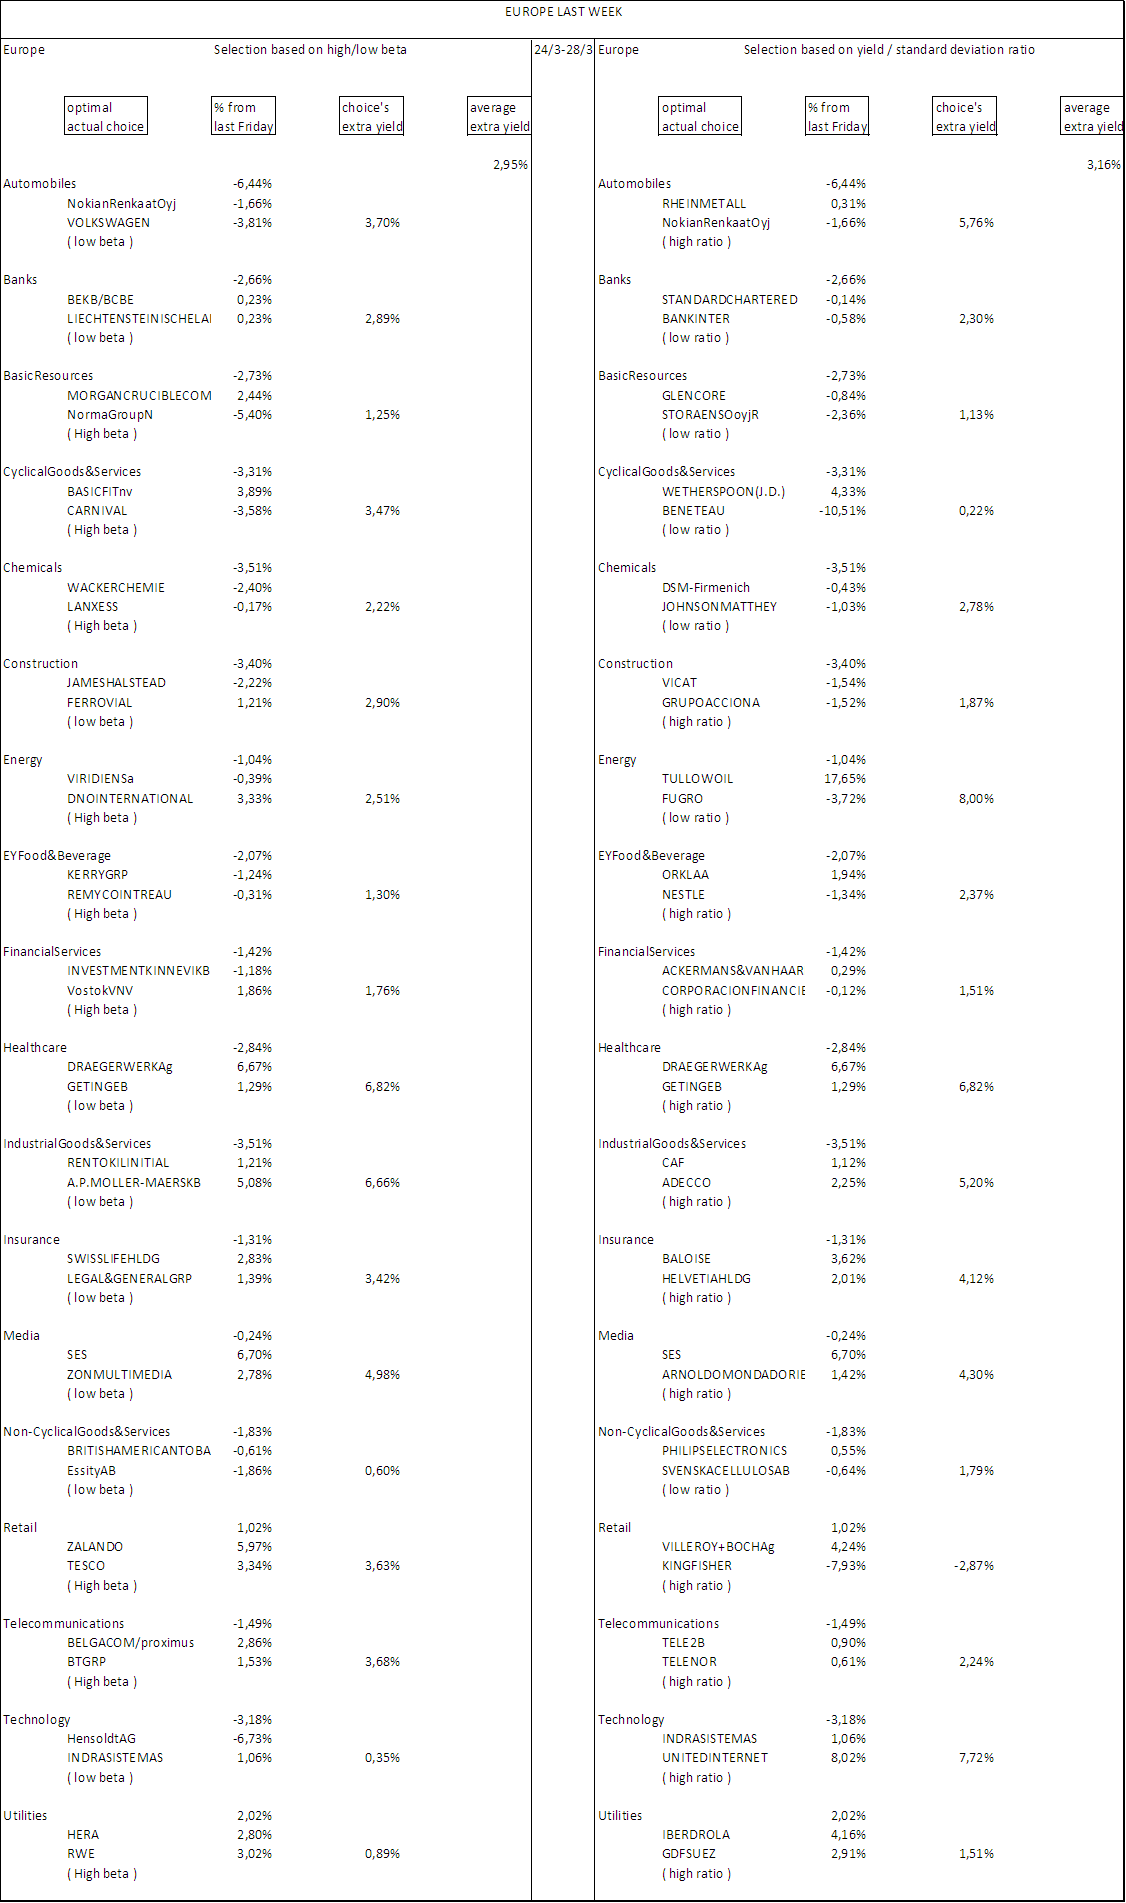
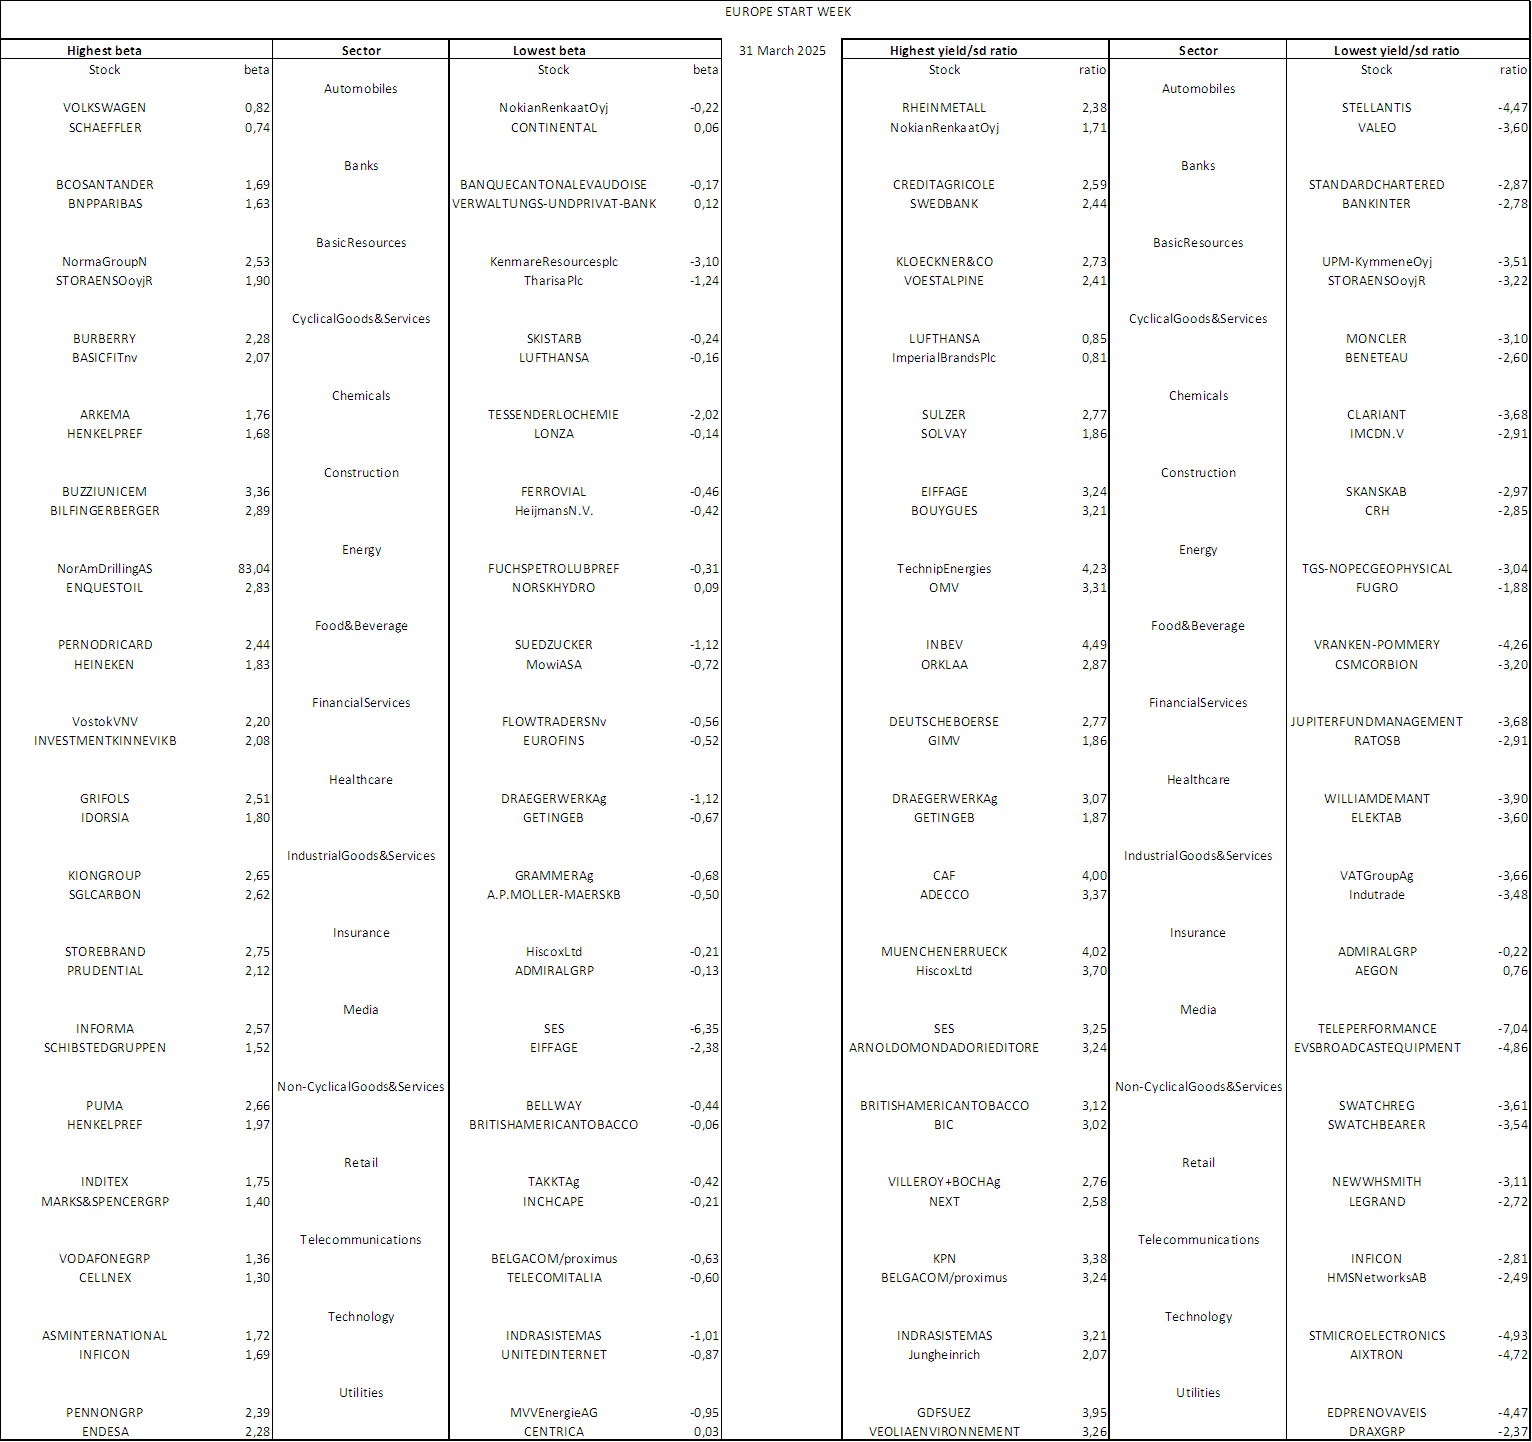
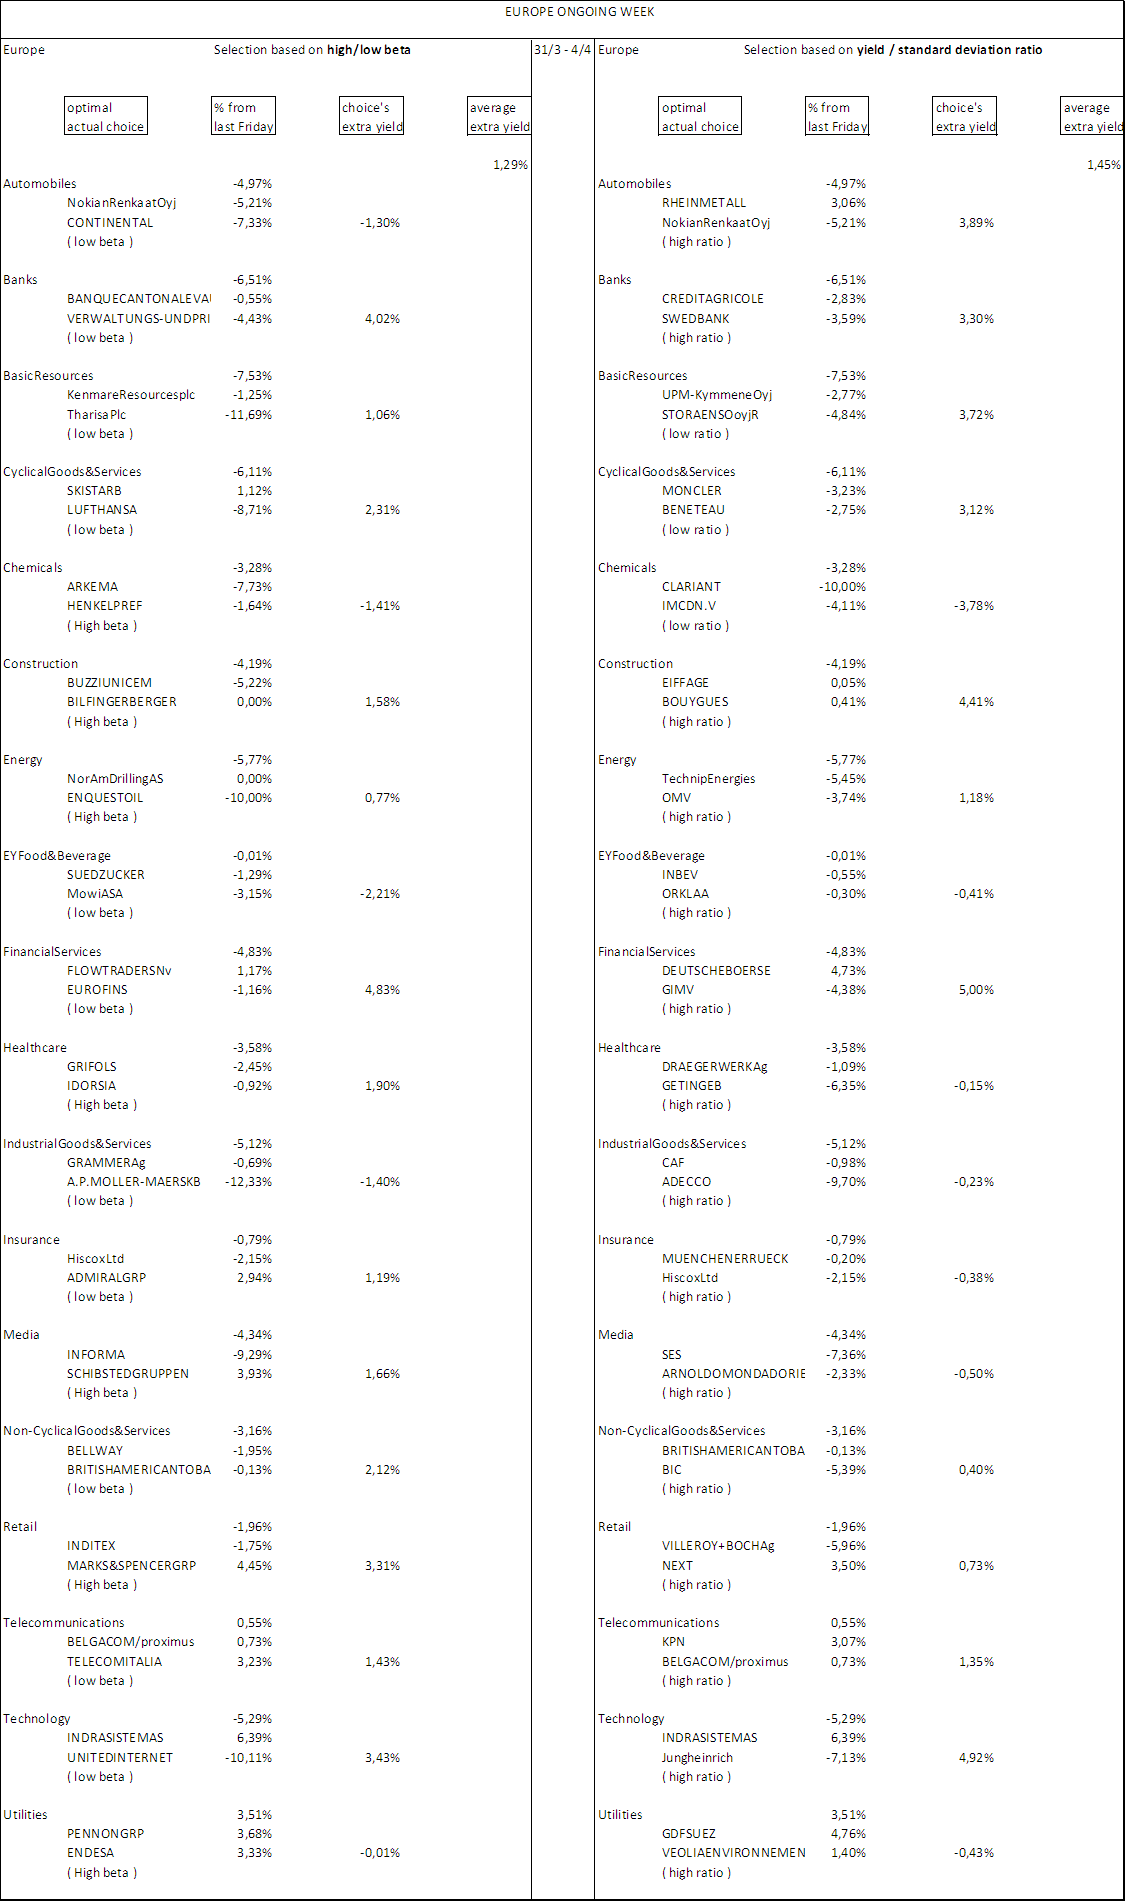
On this page , you can see a selection of stocks , respectively for Europe and Usa , based on highest or lowest Beta , and on best and worst yield/standard deviation ratio (when this is negative , so was the stock yield), for each activity sector . Time period is one month to date . Results are for ended week (last week) and ongoing week (since last friday). Start week tables indicate the selected stocks for ongoing week , those with low beta and low ratio being selected per default . During ongoing week , if a sector trend is positive , high beta and high ratio stocks are being selected because have the best probability to outperformance ; the opposite if a sector has a negative development . For each area , you can see actual position (choice) divided into high or low beta , high or low ratio . The greater high ( beta and ratio) percentages , the better area will perform . Results are net of stock dividends , gross of trading fees . This is a long-only strategy .
Selections results
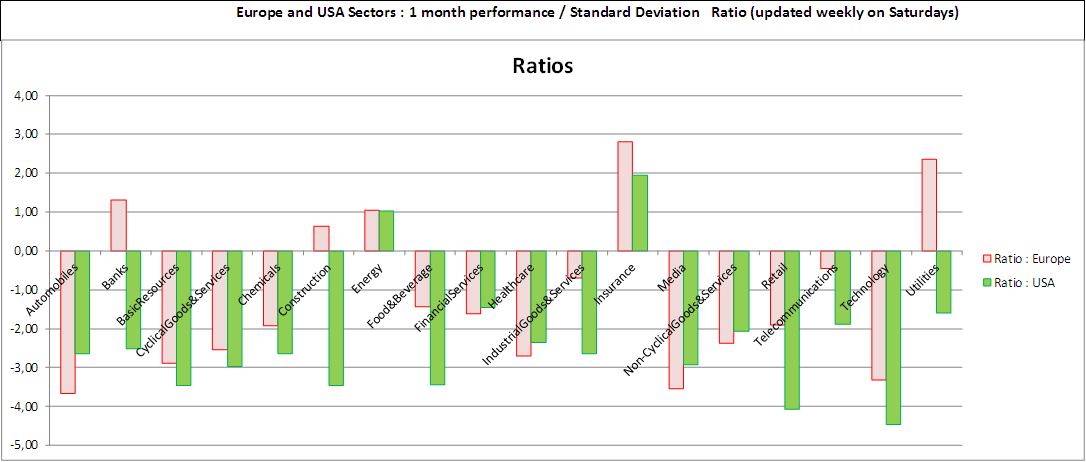
Displaying weekly trends and results following strategy indications . Stock sectors , in Europe and USA , with ratios between their 1-month performance and Standard Deviations . The higher the ratio , the better the performance with lower SDs ; if negative , so was the 1-month trend .
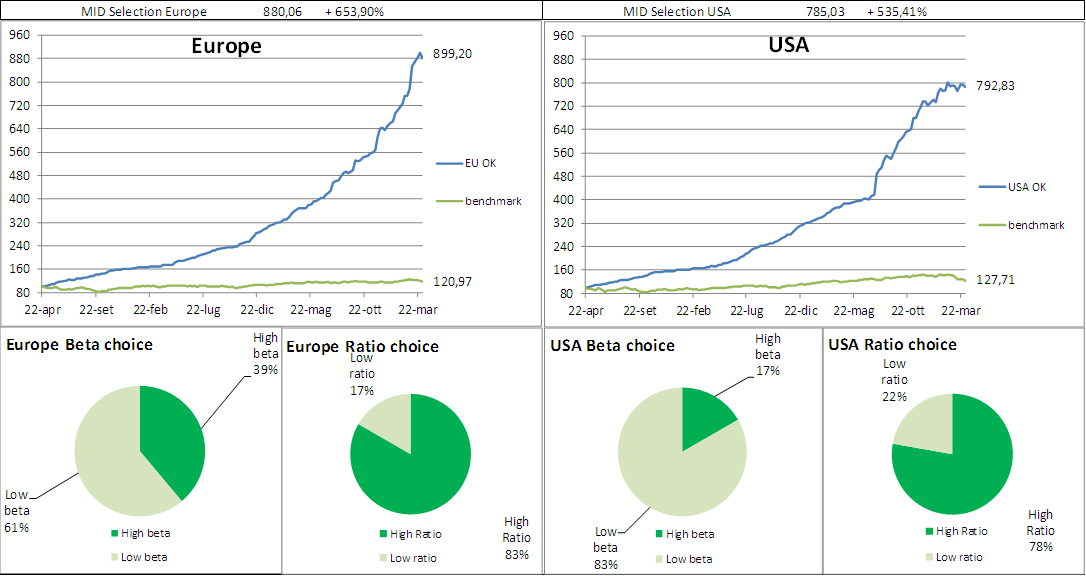
Europe stocks weekly selection
Usa stocks weekly selection
